To keep track of the way we rank athletes and sessions in Sportreact PLUS, it's crucial to understand the scores used for comparison.
T-scores and Z-scores are values that help us compare an individual’s performance to a group. The only difference is that the T-score shows values on a scale from 0 to 100 (with 50 being the group's average), while the Z-score shows a range from -3 to 3 (with 0 being the average).
Why should we compare both T and Z-scores?
T-scores are useful for presenting data in a format that is easier to interpret visually, especially in contexts where negative values might confuse the viewer. On the other hand, Z-scores are more precise, meaning they will show better deviation from the average, and help you easily identify outliers or trends. Let’s test this with an example:

On the above graph (using T-scores), it’s easy to see that Henry J. is the slowest athlete, while Ethan is the fastest, with Alexander not far behind. Logan and Michael appear to have similar results at first glance.
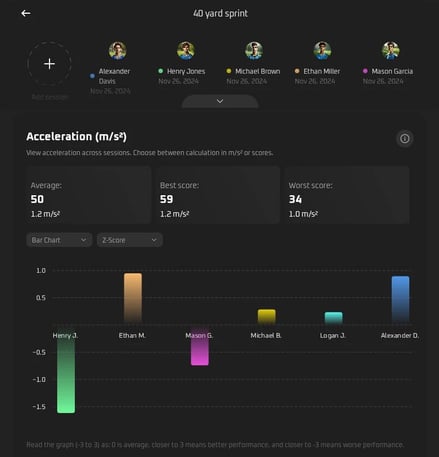
However, when we look at the Z-scores graph above — which uses a more precise scale, the differences become clearer. Henry stands out as a significant outlier, being much slower than the rest of the team. On the other hand, Ethan is noticeably faster than Alexander, more than the first graph suggested. Finally, Logan and Michael remain close in their scores and closest to 0, meaning they are the most average in terms of acceleration in their team.
To conclude:
Z-score: Shows how many standard deviations an individual’s result is from the group average (mean).
How to read? A Z-score of 0 indicates the result is exactly average, while positive values show above- average performance and negative values indicate below-average performance.
T-score: A scaled version of the Z-score, calculated to avoid negatives and make interpretation simpler.
How to read? The mean is set to 50, with each 10 points representing one standard deviation. A T- score of 50 is average, scores above 50 are better, and those below 50 are worse.
*Standard deviation in sports results shows how much the athletes' performance varies from the average score. A smaller standard deviation means the results are close to the average, indicating consistency, while a larger standard deviation means there’s more variation, showing less similarity between the sessions/athletes or any other groups.