Monitor athlete's progress with trend graphs
The Trends section on an athlete's profile provides detailed insights into their performance over any chosen period (1 week, 4 weeks, month, year, or custom range).
For each drill/test, easily view athlete's:
- starting score at the beginning of the season
- ending score at the end of the season
- change rate over the training period
- score (0 - 100) that compares athletes with the team average

Trend graphs provide a clear view of long-term trends and short-term variations, as well as fluctuations in scores.
Colors and change rates show progress or decline.

Scores compare results with team:
- Green: above average
- Orange: near average
- Red: below average
Additional tables and bar charts in the "More Details" section provide exact scores from the trend graph. Go into the details to pinpoint those reps where something changed to identify the cause and take action — whether it's a measurement error or a genuine decline.

Overview of reps that are included in the trend graph.
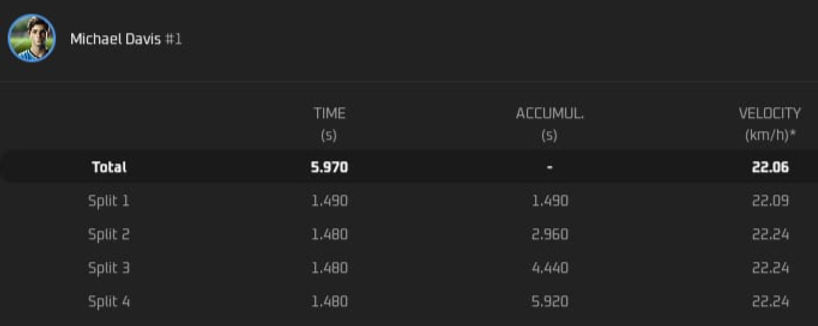
Details of each rep: "View" button shows total times, split times, and velocity to help the coach spot patterns and causes of change.