With athlete profiling you can:
- Track key metrics like velocity, acceleration, power, and force.
- Monitor progress with trend graphs and change rates for every drill.
- Benchmark against team averages and normative data.
Meet "Athlete Profiling"
a) View each athlete's key info
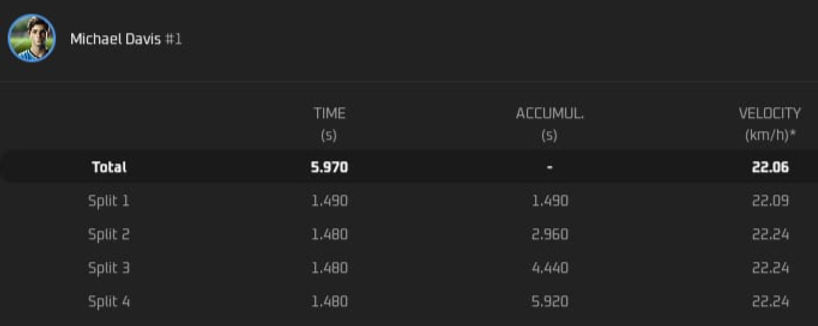
Athlete profile stores the important information about each athlete: in addition to name, photo, and team, it shows height, weight, age, level, and the sports that the athlete trains. A fully completed profile allows coaches to access calculations of velocity, acceleration, power, and force in sprints, as well as the comparison with normative results.

b) Monitor athlete's progress with trend graphs
The Trends section on an athlete's profile provides detailed insights into their performance over any chosen period (1 week, 4 weeks, month, year, or custom range).
For each drill/test, easily view athlete's:
- starting score at the the beginning of the season,
- end score at the end of the season,
- change rate over the training period,
- score (0 - 100) that compares athletes with the team average.

Trend graphs provide a clear view of long-term trends and short-term variations, as well as fluctuations in scores.
Colors and change rates show progress or decline.
Scores compare results with team:
Green: above average
Orange: near average
Red: below average

Additional tables and bar charts in the "More Details" section provide exact scores from the trend graph. Go into the details to pinpoint those reps where something changed to identify the cause and take action — whether it's a measurement error or a genuine decline.

Overview of reps that are included in the trend graph.
c) Benchmark athletes against the norms (BETA)
Sportreact Plus compares each athlete’s best results in each drill to the normative data for their sport, age, and sex from relevant sources. The norms table shows data for athlete's age and higher age groups, marking "green" all ranks the athlete fits. This lets you quickly identify those players who are outperforming their age groups. Sportreact Plus also calculates the difference between the athlete’s results and the normative range for higher categories, showing how much progress they need to advance to the next group.

List of tests with normative data:
*Normative data is available only for standard tests, sourced from relevant scientific articles that have generated and validated it.
Benchmark against the norms is available for following tests:
> Sprint Test 10-20-30 Meter
> T Agility Test
> Arrowhead Agility Drill
> 20 Meter Agility Test (5-10-5 Test)
> 505 Agility Test
> Sprint Test 15-30 Meter
> Zigzag Running Drill
> Cone Agility Test (L Agility Test)
> Illinois Agility Drill
For the following reactive tests, reference values are determined based on the average performance metrics of athletes utilizing the application:
> Stop'N'Go Reactive Agility Test
> Y-Agility Test
d) View all personal bests in one place
The personal bests section displays each athlete's top scores across all drills on a single screen. The search function lets coaches easily find specific results, including the exact data and time of each session when the personal bests were achieved.

e) Compare athlete to team-wide data
By saving data for each athlete, coaches access team-wide calculations such as team averages, and scores of highest and lowest performers. Athlete analytics provide a quick overview of each athlete’s results compared to the team, across multiple drills and selected metrics, all displayed in the performance graph.
To compare athlete to team-wide data:
1. Select the team you want to compare your athlete to.
2. Choose two or more drills you wish for assessment.
3. Select a metric for each drill (For sprints: total time, velocity, power, force. For hits: total time, number of hits, min, max, average).
4. Set the period for comparison.
The athlete's score (t-score, 0-100) is the average of their selected drill scores, standardized to team's results. This gives a clear view of how the athlete compares to the team average. A score of 50 is average, so anything over 50 indicates above-average performance, and below 50 reveals lower performance than the team's average.
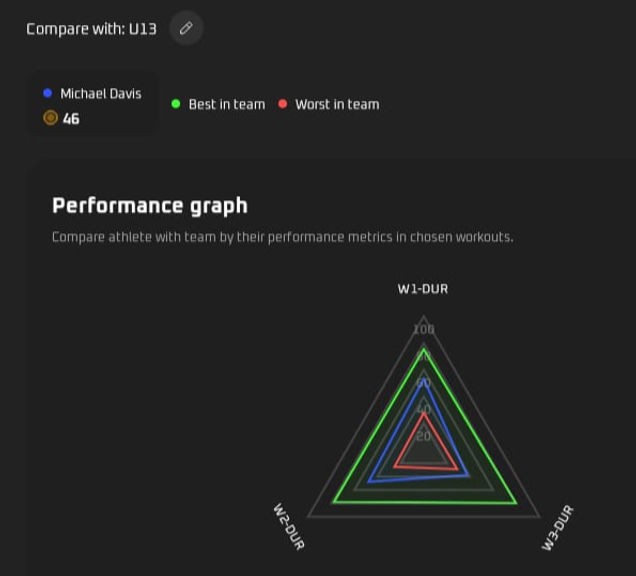
f) Easily visualize data with spider graphs and charts
Performance graph is a simple visualization based on the athlete's score showing how they rank relative to:
✓ highest and lowest performers
✓ in each of the selected drills/tests.